

.png)

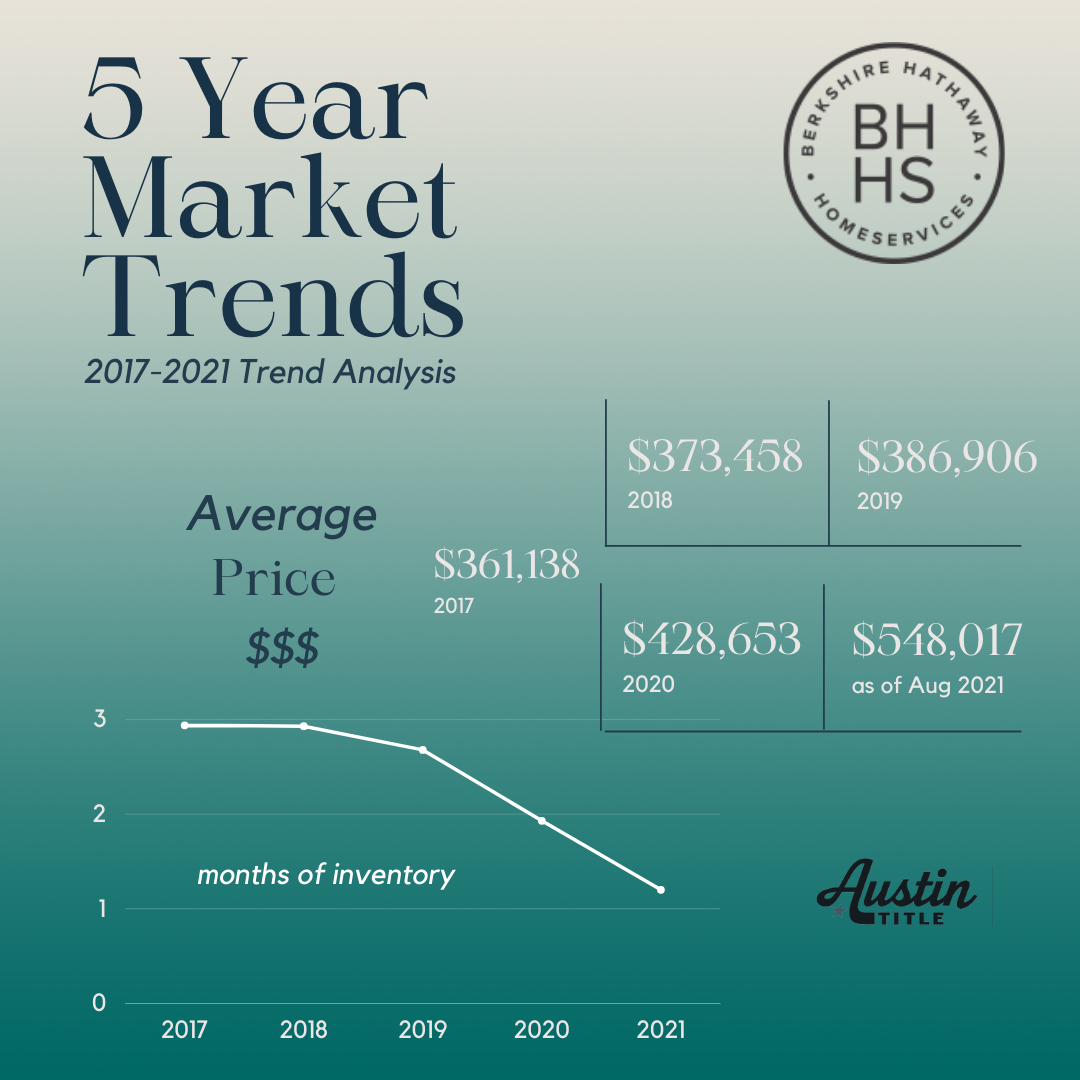
5 Year Market Trend Update
.png?w=1140)
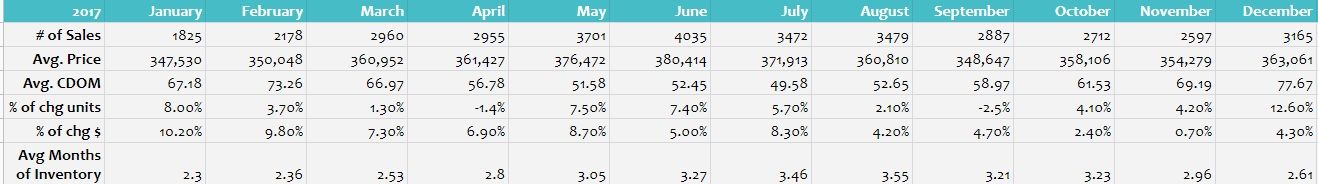
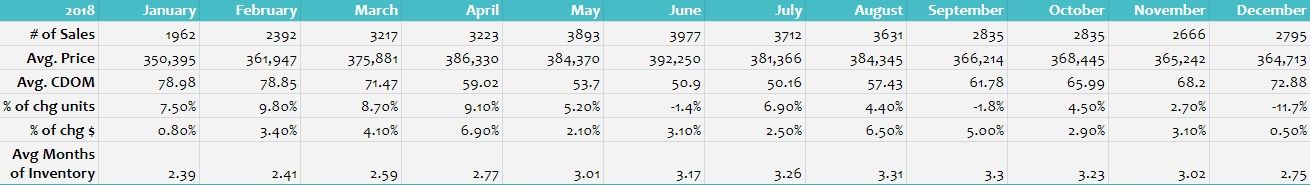
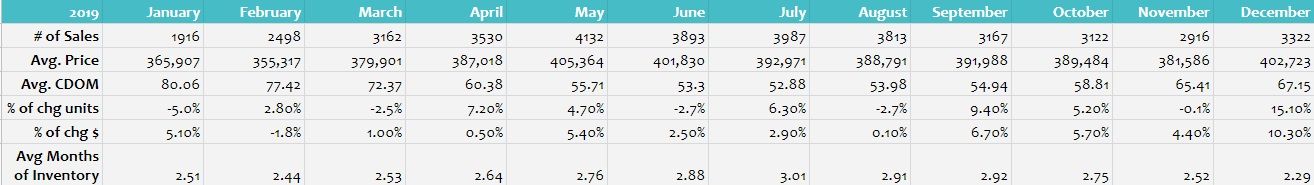
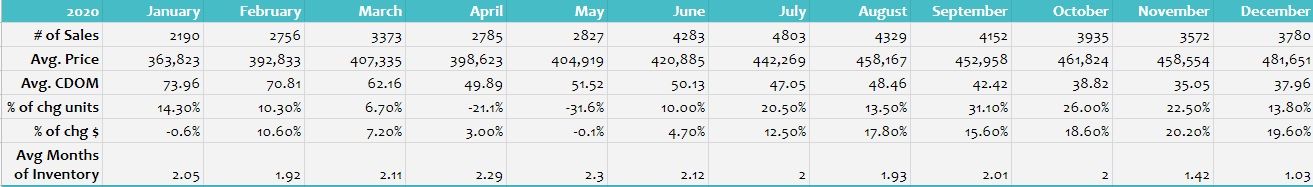
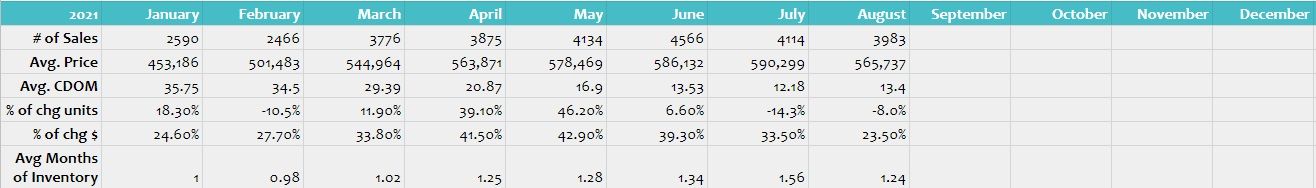
Yearly breakdown
This Week in Review
October 24th thru October 30, 2021
+19.48%
New Listings
+80.99%
Pending Listings
-28.97%
Homes Sold

$430,00
Median Sales Price

1.09
Months of Supply

3,990
Current Active Listings

6,898
Active Listings this time last year